 Research Article
Symmetry of a Set of Leaves in The Average And Asymmetry of Each Leaf of a Birch (Betula Pendula)In The Dynamics of Ontogenesis
P. M. Mazurkin*
Dr. tech. sciences, prof., Volga State University of Technology,
Peter Matveevich Mazurkin, Dr. tech. sciences, prof., Volga State University of Technology, Russia.
Received Date:April 25, 2023; Published Date:May 18, 2023
Abstract
A method is shown for analyzing the vibrational adaptation of each birch leaf in the growing state by measuring the left and right sides in the dynamics of ontogeny and fluctuations in the asymmetry of 12 morphological characters. Comparison proved that the fluctuating asymmetry in 25 leaves, on average, obeys the Gaussian law of normal distribution, but for each leaf at different growing periods, wave transitions from left to right asymmetry and back are observed at a statistical significance level of 0.01 (measurement errors of 1%). The scientific novelty is the ontogeny of the meadow grass population according to the data of T. A. Rabotnov in terms of population size from age and the ontogeny of each leaf of drooping birch without cutting consists primarily not of state stages, which is secondary, but of behavior quanta in the form of asymmetric wavelet signals, fractally distributed in time of ontogeny in the form of a set of components. In a birch leaf, the fluctuation is aimed at equalizing the asymmetry. The maximum relative modeling error for five components is 2.83%. A method for measuring the photodynamics of the morphological features of each registration sheet is proposed. The method of wavelet analysis of oscillatory adaptation of plants can be used for ontogeny dynamics series obtained in the past and future to identify asymmetric wavelet signals.
Keywords:Birch; Leaves; Ontogeny; Dynamics; Patterns
Introduction
The textbook [1] defines development and growth “7. Development and growth. In the process of individual development (ontogenesis), the individual properties of the organism are gradually and consistently manifested and its growth is carried out. In addition, all living systems evolve - they change in the course of historical development (phylogenesis).” A clarification is given (p. 129) “The process of individual development of an individual from the beginning of its existence to the end of its life is called ontogeny.”
Then it turns out that the ontogeny, for example, of each leaf of a birch (Betula pendula) in dynamics from bud break to its fall gives a strong oscillatory variability (fluctuation) of asymmetry, and on the average (arithmetic) for many leaves that differ sharply from each other, an apparent absolute symmetry. Moreover, the distribution of fluctuating asymmetry in many leaves will obey the so-called “normal” Gaussian law. But asymmetry, as the main parameter of the Universe (Docazana…, 2021), will remain even with large numbers of leaves (one adult birch has an average of 105 leaves) and the birch trees themselves, which are common throughout the Northern Hemisphere of the Earth [2].
The main object of global and local environmental monitoring can be a birch with accounting leaves without cutting them accord ing to our inventions. The birch forests of the northern hemisphere (the Holarctic kingdom according to A.L. Takhtajan [3]) occupy half the world along the Arctic Ocean. Longitudinal dendrochronological birch transect along the Arctic Ocean was studied at the Academy of Sciences of the USSR (Lovelius, 1974).
The average leaves (marked with white threads with tags) are needed to compare the development and growth of leaves at higher structural and functional levels. According to [4] “During the implementation of hereditary information in the process of ontogenesis, the organism forms species and individual morphological, physiological and biochemical properties, in other words, a phenotype. In the process of development, the body naturally changes its characteristics, nevertheless remaining an integral system. Therefore, the phenotype must be understood as the totality of properties throughout the entire course of individual development, at each stage of which there are its own characteristics.
We noticed a clear oddity in biologists’ publications. They give a detailed structural analysis of the shape of the leaves, highlighting the stages of ontogeny, and try to use them to identify the functional features of the behavior of the set on average. However, they completely ignore the main parameter of functioning - the time from the moment of the beginning of ontogenesis to the moment of abscission. Taking into account the time in days (the cycle of the Earth’s revolution around itself) would allow at first to abandon the stages of ontogeny and consider the continuous dynamics of the development and growth of each leaf, without taking into account the discreteness of morphogenesis.
To assess the state of meadow cenopopulations, based on the concept of the biological age of plants, nine ontogenetic states were identified in the individual development of I. aphylla: seed, seedling, juvenile, immature, virginal, young generative, middle-aged generative, old generative, and senile [5]. At the same time, the periodization of ontogenesis proposed by T. A. Rabotnov [6] and supplemented by A. A. Uranov [7] was used.
T. A. Rabotnov himself [6] writes; “Usually, each independent, spatially delimited from others, above-ground shoot or bush, which has its own root system, it is advisable to consider it as an individual.” Marks a convex curve of the development of an individual [6]: “... the level of the vital state of an individual, its vegetative power, after reaching its sexually mature state, increase to a certain limit, and then, as the individuals age, they decrease.”
Further [6] notes that the life span of plants depends not only on their biological properties, but also on the growing conditions. In those days, biologists were fond of grouping data, so the recommendation “For ease of review, the studied individuals are grouped into age classes with an interval of 5 years” is a mistake due to the fact that grouping (especially grouping and averaging) changes the original meaning of a number of primary values of the studied indicator.
He proposed a method for measuring the age of herbaceous plants [8].
The following recommendation is important for us [6]: “In the in-depth study of cenoses, the method of observing fixed individuals for a long time deserves special attention. In this way, valuable materials can be obtained for clarifying many questions of phytocenology and plant biology. Then, according to T. A. Rabotnov, the accounting leaves of drooping birch can be considered “fixed individuals”. This allows us to initially abandon the ontogeny of the birch population itself.
Then A. A. Uranov introduced the concept of a long life cycle [7], in which he proposed to take into account not nine, as according to T. A. Rabotnov, but 11 age states (and in the article [9] proposed eight ontogenetic states). But he himself shows the difficulty of distinguishing these states [7]. Some of his heuristic arguments are important for us. For example, the gradualness of transitions is manifested to the greatest extent if, when distinguishing age states, one is guided by quantitative signs. The latter, moreover, to a large extent depend on the topological conditions and the meteorological conjuncture. Quantitative characters usually change in parallel with the change in age | states along a smooth one-peak curve.
In the meadow phytocenosis [10], the lack of registration of the time of the stages of ontogenesis of a blade of grass is justified by the high complexity and variability. In our opinion, the ban on measuring the current time is clear from the phrase of A. A. Uranov: “With a small number of descriptions (less than 10), the derivation of averages does not make sense.” The doctrine of the inviolability of the arithmetic mean, at the suggestion of the great Gauss, for almost 300 years hindered the science of the development of processes in plant ontogenesis.
The reasons for the rejection of the current time will be considered using examples from [11].
According to [11], the main task of phenology is to observe changes in the annual (revolution of the Earth around the Sun) cycle of plant development. Data collected in different areas or at least in one point, but in different years, are compared with each other. Phenology, in addition, faces the task of identifying patterns in the course of periodic development and determining the dependence on environmental conditions. The German scientist singled out a special area of phenology in the form of phenometry, when measurements of the course of plant growth are performed using instruments.
But here again there is nothing about the measurement of the current ontogenetic time. It is noted that the greening (unfolding of leaves) of a birch for a period of time from 1751 to 1930 near Norwik (England) occurred in 1-9 days (on average, 4 days).
The purpose of the article is to compare the arithmetic mean of the asymmetry parameters of a set of birch leaves, to compile descriptive statistics and to identify patterns of oscillatory adaptation of each registration sheet during the growing season.
Materials
Methods for measuring the asymmetry of birch leaves: The time during which the leaf performs the function of photosynthesis plays an important role in the life of the plant and the ecosystem. As a first approximation, this time is defined as the life span of the leaf. Since the time of leaf development inside a bud varies greatly between species, the lifespan of a leaf is defined as the interval between the appearance of a leaf from a bud and its abscission [12].
The asymmetry of birch leaves must first be studied in cities. According to [13], studying the impact of urbanization processes on urban ecosystems should help predict possible scenarios for the development of life on Earth.
The arithmetic mean of the relative difference between the parties by five traits according to leaf measurements [14] was taken as an integral indicator of developmental stability. When the height above sea level changes by 14.9 times at six points in the Krasnodar Territory, this indicator changes its values by 55.77%.
In contrast to the known method [15,16], we replaced the morphological sign of the width of the leaf halves with the maximum width of the leaf halves (Figure 1). It turned out not five, but six distinguishing features for each birch leaf. All six morphological parameters are found in the part of the leaf near the petiole.
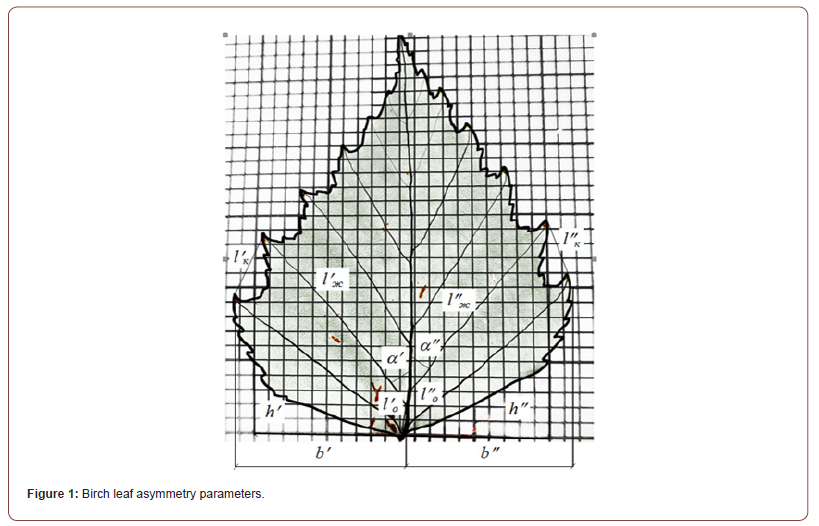
The leaf asymmetry parameters are as follows: b′ , b′′ – maximum width of the left and right halves of the sheet, mm; h′ , h′′ – height from the base of the sheet to the maximum width, mm; l′æ,l′′æ – length of vein of the second order, second from the base, mm; l′î,l′′î – distance between the bases of the first and second veins of the second order, mm; l′ê,l′′ê – distance between the ends of the same veins, mm; α ′ , α ′ – the angle between the main vein and the second vein from the base of the leaf of the second order, о.
The procedure for experiments on live counting leaves without cutting them is given in the manual [17]. The measurements are carried out in two stages: a) photographing the accounting leaves together with the palette using a cell phone camera; b) on the computer screen, the execution of procedures for measuring 12 morphological parameters after enlarging the leaf width to the full screen. After that, the results of the calculations are placed in an Excel table, and then the patterns are identified in the software environment CurveExpert-1.40.
The method of photodynamics of accounting leaves is given in [18].
Initial data on the dynamics of vegetation of accounting leaves: For photodynamics and subsequent measurements, up to 25 countable leaves from five birch trees are sufficient [17]. The recommendation [16] on a one-time removal of 100 leaves (10 birch trees with 10 leaves each) comes from the requirement [10] “With a small number of descriptions (less than 10), the removal of averages does not meaning.”
But, in this article, we do not propose to use the data grouping method to calculate the arithmetic mean. Each individual in the form of a growing leaf is a unique organism. Without averaging and calculations according to the method of descriptive statistics, it is necessary to identify the wave patterns of oscillatory adaptation (fluctuation) of each birch leaf by the identification method.
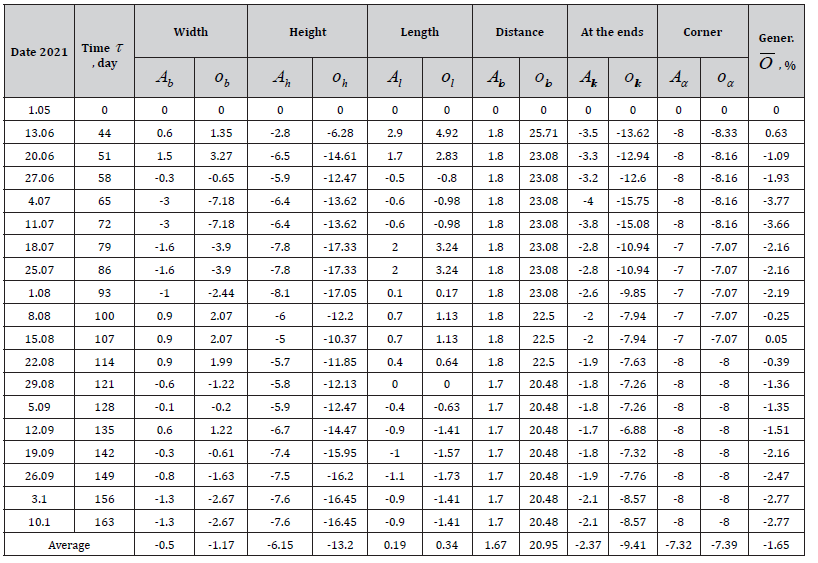
First, we show the effect of groupings on the arithmetic mean values of the 25 recorded leaves, the following individuals reached their fall: 4 - 163 days (until 10.10.2021); 11 - 156 days (03.10.2021); 1 - 149; 1 - 142; 1 - 135; 3 - 100 and 4 - 79 days (Table 1).
Table 1:Initial data on measurements of all 25 accounting birch leaves.

05/01/2021 was taken as the beginning of the growing season at the time of bud break. Then, at the longest time of 163 days before leaf fall, the error in taking into account the onset of ontogeny (4 days on average according to (Schnelle, 1961)) is 100 4 / 163 = 2.45%.
The first measurement of photodynamics was made at about 15:00 hours 44 days after the start of bud break. When measured after 19 days [17], spatial graphs of ontogeny dynamics are shown in Figure 2.
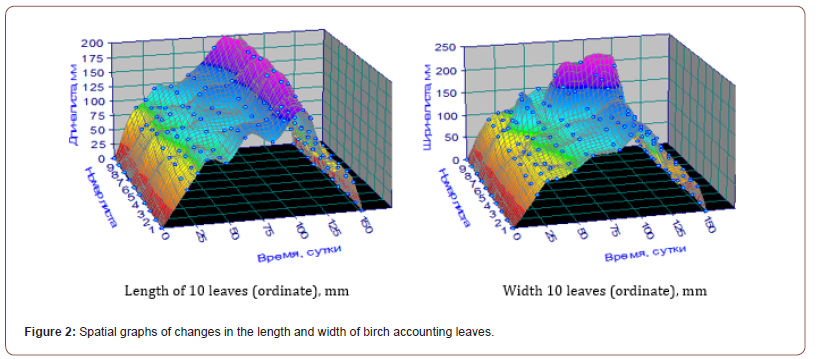
It can be seen from the spatial graphs that the dynamics of ontogeny can be divided into two stages: a) the onset of ontogeny without noticeable fluctuations in morphology from 0 to 30 days; b) there is a dynamics of fluctuations in the parameters of accounting leaves.
Then it turns out that this article is devoted to the study of the second stage of ontogenesis with oscillations.
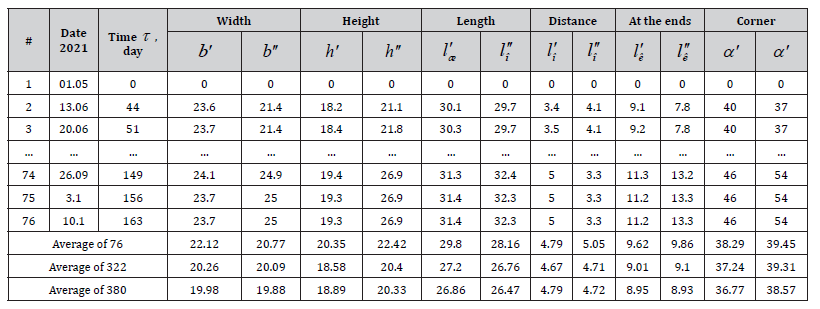
Initial data on the dynamics of vegetation of the best accounting leaves: 18 accounting birch leaves with vegetation periods from 163 to 135 days were recognized as the best (Table 2). In these individuals, the moment of falling off was noticeable, and in the seven worst birch leaves, the reasons for the termination of ontogenesis were insufficiently identified.
In comparison with Table 1, due to the increase in the growing season, the average values for all 12 morphological characters have changed upwards.
Initial data on the dynamics of vegetation of strong accounting leaves: Obviously, the leaves with the longest growing season are physiologically strong. There were four such leaves with an ontogeny period of 163 days (Table 3).
As can be seen from the data in Table 3, with the transition from all 25 counting leaves to strong four individuals, all 12 parameters of the asymmetry of the counting sheets increase.
Table 2:Initial data on measurements of the best 18 birch leaves.
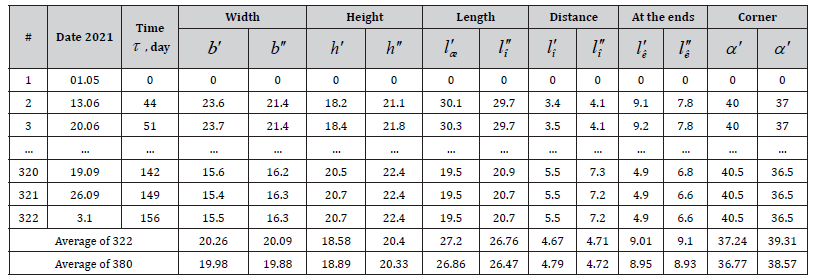
Table 3:Initial data on strong birch leaves.
Initial data on the dynamics of vegetation of one strong accounting sheet: Each birch registration sheet has its own character of behavior. Let us choose one registration sheet, in which over time from 05/01/2021 to 10/10/2021 there is a transition from right-sided to left-sided asymmetry. In this case, there is a strong oscillatory adaptation of the registration sheet No. 4-1 (Table 4) to the external conditions of life, which changes during ontogenesis in the air space around this sheet.
Table 4:Initial data on birch strong sheet No. 4-1.

Notes: bold indicates maximum values, italics indicate minimum values.
The comparison shows that for one record sheet strong in terms of the growing season, all 12 morphological indicators differ significantly from the group averages.
Initial data on the fluctuating asymmetry of one birch registration sheet: Table 5 shows fluctuation rates for birch leaf No. 4-1.
The following designations are adopted here (when viewed from the front side of the sheet):
Table 5:Fluctuating asymmetry data for birch registration sheet No. 4-1.
A – absolute asymmetry of the left from the right side of the
sheet, A = y′ − y′′ ;
o – relative asymmetry according to the formula
o =100A/( y′ + y′′) , %.
In this case, the sign + A will always show left-sided asymmetry, and with the sign − A there will be right-sided asymmetry of the birch count sheet.
The dynamics of ontogeny is characterized by the fact that each leaf, due to changes in phenotypic factors, during the growing season can several times move from left-sided to right-sided asymmetry and vice versa. The dimension of relative asymmetry in percent gives advantages in computer calculations and visibility.
General relative asymmetry O = f (τ ) according to 12 morphological features (six left and six right sides of the sheet) is calculated by the formula.

On average for accounting sheet No. 4-1 birch drooping O = −1.65 % .
There is a well-known scale [16] of the indicator of developmental stability: I point - less than 0.040, which means that air pollution does not affect the plant, there is a high stability in the development of birch leaves; II - 0.040-0.044 weak influence of unfavorable factors; III - 0.045-0.049 for moderately polluted places; IV - 0.050-0.054 contaminated sites; V - more than 0.054 for heavily polluted areas.
For sheet No. 4-1, developmental stability was obtained O =1.65 % or (without taking into account the left and right sides) 0.0165. This value is much less than the first score of 0.040. The indicator characterizes only a small sphere around one accounting sheet of birch, therefore, for other accounting sheets, other values of the stability indicator are possible.
Initial data on fluctuating asymmetry of all 25 accounting leaves: Table 6 shows the following parameters according to the birch leaf accounting codes:
Table 6:Relative asymmetry of leaves on average for the growing season.

T – growing season of each of the 25 accounting birch leaves,
days;
O – average relative asymmetry over the growing season, %.
On average, for 25 leaves was obtained 0.034% 25 O = , Therefore (according to V.M. Zakharov) the leaf population gives a high stability of ecological development 0.00034 << 0.04. A wide range of changes (developmental instability) was obtained for individual registration sheets from -5.45% (right-sided asymmetry) to 11.31% (left-sided asymmetry). This interval overlaps the range of developmental stability index [16] in air microvolumes around each birch census leaf.
Then the function O = f (T ) is influenced by many phenotypic factors that vary significantly for individual leaves.
Methods for Identification of Regularities by The Results of Measurements
Generic Asymmetric Wavelet for Simulation: In nature, all processes occur according to the wave equations of oscillatory adaptation according to the general formula of the quantum of behavior [19-24] in the form of an asymmetric wavelet signal (solitary wave)

where y – is the indicator (dependent factor), i – is the number of the component (2) or quantum of the system behavior, m – is the number of members (quanta) in the model (2), x – is the explanatory variable, a1...a8 – are the parameters of each member of the model (2); Ai – is the variable amplitude (half) of the asymmetric wavelet, pi – is the variable half-cycle of the oscillation.
A trend is formed when the oscillation period a_5i tends to infinity. Most often, the trend is formed from two members of the formula (2).
Patterns of the number of individuals in a grass population from age: Using the initial data as an example [6] (Table 1), we will show the identification of the wave equation (2). The results are shown in Table 7 and Figure 3. The age range is from 0 to 45 years, since there are gaps in the data after 45 years.
Table 7:Components of the model (2) wavelet analysis of the number of individuals from age.

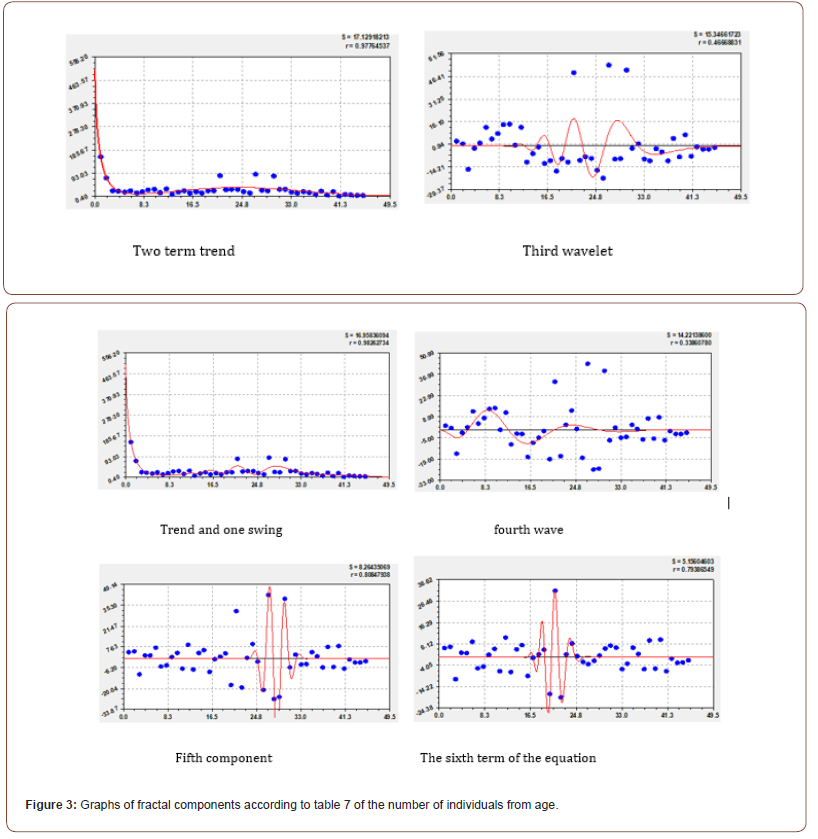
In total, six components were identified in the form of wavelets of the general model (2) of the dynamics of the number of individuals in the population of anemone tufted on the fire-moist-forb subalpine meadow.
The first term is the Mandelbrot law modified by us in the form of the law of exponential death. According to the classification [7], the left-sided spectrum indicates that the population is young. If the sign of the first term is positive according to the law of exponential growth, then the spectrum will be right-handed. In this case, the population should be considered as a residual set of individuals and characterized as relatively old.
The second component is the biotechnical law of prof. P. M. Mazurkin [19] and he physically characterizes the stress excitation of the population in a certain age interval. It is he who determines the diversity of spectra from a young population to an old one. Therefore, the first two terms (Table 7) make it possible to perform a spectral analysis of the number of populations depending on age. For all meadow cenoses on Earth, there may be an infinite number of spectra.
Together, the three terms represent the computational capabilities of the CurveExpert-1.40 software environment. Therefore, the overall correlation coefficient (a measure of the tightness of the relationship) is 0.9826. According to the level of adequacy (0.5-0.7 - medium connection, 0.7-0.9 - strong connection, 0.90-0.95 - the strongest factorial connection, 0.95-0.99 - superstrong connection the first three terms give the level of superstrong connection.
The four waves show the oscillatory adaptation of the population with age. All of them belong to finite-dimensional wavelets, so they have relatively clear left and right age boundaries. Moreover, all six components show fractal (according to Mandelbrot) distributions and therefore are quanta of population behavior.
Results and Discussion
Technical solutions for indication methods at the level of inventions: Since 2001, 18 patents for inventions have been received for indication and testing of the natural or naturalanthropogenic environment with the leaves of trees (birch, oak and spruce). The first patent No. 2374828 (to get a description of the patent, you need to type the number of the patent for the invention on the website https://fips.ru/registers-web/ action?acName=clickRegister®Name=RUPAT) in 2007 was obtained for a method of testing plants according to leaf sample weight.
In patent No. 2466351 (06/08/2011), for the first time, a method was proposed for photographing taken (cut) leaves of different plants through a transparent mesh palette on a cell phone. Patent No. 2477039 protected a method for measuring the shape of the leaves of woody plants, for example, cut oak leaves, each of which is placed on a sheet of graph paper and then outlined with a pencil.
With master Semenova D.V. patents (2549779, 2556980, 2556985, 2556987, 2559748 and 2580647) were obtained for methods of indicating the city square by measuring and modeling the asymmetry of birch leaves. At the same time, V. M. Zakharov’s method for the asymmetry of leaves of silver birch did not change [25].
Then a method was developed for photoindication of drooping birch leaves without cutting them [26-32]. Method patents have been obtained (2589487, 2597643, 2597645, 2606189 and 2615363). Moreover, in the latter method, asymmetry fluctuations were noticeable during ontogenesis. The method for measuring the length, width, perimeter and area of count leaves includes such actions. A transparent palette with a grid (cells 2×2 mm) is placed on the front side of the growing leaf so that the middle line along the palette coincides with the axis of the longitudinal vein of the leaf. On the reverse side of the sheet, a white solid substrate is placed. The palette sheet is then photographed with a digital camera with a photo storage function. On the computer, the photo of the sheet is cut, then enlarged for measurements to A4 format.
We consider the relative fluctuating asymmetry of 12 morphological parameters of birch leaves during the growing season as an oscillatory adaptation of each record sheet to changes in the external environment surrounding this leaf.
Urban environment and biometeorological assessment based on birch leaves: The center of the city of Yoshkar- Ola is located in geographic coordinates (East longitude 47.8908o, North latitude 56.6388o, elevation above the Baltic Sea 94 m). The territory of the city is only about 10 km2, therefore, for any places of pollution indication, these coordinate values can be conditionally accepted [33]. We consider urbanization as a geographical contraction of all parameters of the life of the population, including the population, to the centers of the capitals of the constituent entities of the Russian Federation. The population gradually centrifugally tends to the centers of the capitals of the subjects of the federation.
Biometeorological assessment of climate and air quality in Germany is carried out for urban and landscape planning [34]. All 104 surveyed (five factors and 12 indicators) German cities were divided into four groups according to the readiness index for adapting to a changing climate [35]. Basically, urban biometeorology is needed for humans [36]. The growing season becomes one of the important ecosystem processes, since leaf development is very sensitive to air temperature. Therefore, the future of climate is in leaf observations [37]. It is especially promising to monitor the behavior of glandular hairs on the surface of drooping birch leaves [38]. The leaves produce them throughout the growing season.
The microclimate in the urban environment is formed by communities of trees, shrubs and lawn grasses. The article [39] discusses phytometeorology, in particular, the influence of the sum of temperatures on the leaves of drooping birch in ontogenesis. Highly adequate models with wave components were obtained on the accounting leaves of a young birch growing in ecologically clean conditions. It has been proven that air pollution dampens the mechanism of oscillatory adaptation of leaves in ontogeny.
Regularities were also obtained showing a relatively weak influence of groups of five accounting leaves located on separate branches, depending on the azimuth, radius from the axis of the trunk and the angle of junction of the branch to the trunk of a young birch [17]. Each index sheet was marked with a white thread with a sheet number tag attached to the petiole at the base of the sheet. The monograph [40] also shows the distribution of grass, bushes, and trees.
Descriptive statistics of one record sheet without cutting it. Variation - the difference in the values of a distinctive feature in different units of a set of parameters for the same period of time. The first zero values from Table 4 are not taken into account (18 measurements). The results of calculating the indicators of descriptive statistics to justify the required number of measurements in a given period of time will be placed in Table 8.
Table 8:Descriptive statistics of the distribution of sheet halves measurements #4-1.

Table 8 shows the following indicators of descriptive statistics: amax – maximum value in the sample; amun – minimum value; R – range of statistical sample values; a – arithmetic mean; aë – mean linear deviation; σ2 – sample variance; σ – standard (root mean square) deviation; ρ – relative range; m – relative deviation; V – coefficient of variation (indicator of variability), %; P – accuracy rate, %; aòåîð max – theoretical maximum value; aòåîð min – theoretical minimum value; [n] – allowable number of observations (measurements), pcs.
Table 9:Parameters of the model (2) of the dynamics of ontogeny for the overall relative asymmetry.

Absolute Variation Parameters. The range of the sample is given by the formula

The range of variation shows the change in the values of the attribute with fluctuations from the maximum to the minimum, but does not take into account the distribution of the attribute between them.
The arithmetic mean a of the sample is determined by the formula

where i – is the number of a member of the statistical series, from 1 to 18, n – is the number of members of the statistical series (18), pcs., ai – is a member of the statistical series on the left or right sides of the registration sheet.
The average linear deviation aë characterizes the average deviation modulo the individual values of the attribute from the average level and is determined by the expression

The variance σ2 of a small sample relative to the arithmetic mean of the indicator, with the number of observations less than 20, is calculated by the formula

The standard deviationσ is defined as follows:

The standard deviation shows the absolute deviation of the actual (measured) values of the indicator from the arithmetic mean.
Relative measures of variation. The relative range ρ of variation (coefficient of oscillation) is determined by the relation

The relative modulo deviation m (linear coefficient of variation) is calculated from the mathematical relation

The coefficient of variation V , % (variability index) of the statistical sample will be determined by the formula

The coefficient of variation of a random variable (in the next section we will show that 12 parameters of the accounting sheet are not random, but quite regular) - a measure of the relative spread of the values of a random variable; shows what proportion of the average value of this quantity is its average spread. Unlike the standard deviation, it measures not the absolute, but the relative measure of the spread of the attribute values in the statistical population. Calculated as a percentage. The greater the value of the coefficient of variation, the relatively greater the spread and less evenness of the values of the indicator under study.
The observation accuracy index is calculated by the formula

According to Table 8, the maximum value of the accuracy index is 3% for the width of the right side of a birch leaf, which is much less than the value of 5% allowed in technical experiments.
Data credibility and allowable number of measurements: Confidence intervals for changes in the studied indicator will be equal to:

At the level of statistical significance α = 0.01 (measurement errors 1%) and the number of observations n =18 , Student’s t-test is [t] = 2.88. Student’s distribution or t-distribution depends on only one parameter - the number of degrees of freedom, which is equal to the number of individual values of the feature (the number of observations in the sample). The value of the t-criterion for a given number of degrees of freedom and the level of statistical significance α can be found in the lookup tables.
To exclude observation, it is necessary to find out the essence of the deviation (the so-called “special” measured points). Formally, if the relation

then such an observation is left in the statistical population. In biology, singular points (assuming high reliability of the initial data) are carefully studied, since this is where scientific breakthroughs can turn out.
Из product, the allowable value of the minimum number of measurements [n]is calculated by the formula .

Let us take the measurement error [Δ]=1% and the value of Student’s criterion [t]= 2.88. The calculation results are shown in Table 8. It turned out that the maximum allowable number of observations is 5.62 (the nearest maximum integer is 6) for the width of the left side of a birch leaf. In this case, condition (13) is satisfied. Then we can conclude that the statistical sample of 18 members (excluding zero values at the beginning of ontogeny) for sheet No. 4-1 for 12 parameters completely obeys the normal distribution according to the Gauss law.
However, at least 15 measurements are required to identify wave patterns by the identification method. The measurements were carried out every 7 days (1/4 of the lunar cycle). The closer the dates of measurements to the beginning of the growing season on May 1, the higher the measurement error. Therefore, in the vegetation period from 0 to 30 days, it is necessary to clarify the proposed method of fluctuating asymmetry of birch leaves.
Patterns of dynamics of ontogeny of a separate record sheet: We exclude the 0.05% significance measure [41], as indicated by the results of descriptive statistics in Table 8 and evaluate the adequacy of the formulas by the correlation coefficient. The dynamics of growth and decline of accounting birch leaves [42,43] of leaves has a high quantum certainty, individual wave components give a clear decomposition into behavioral quanta during the growing season.
To identify formula (2), table 5 was adopted with 19 measurements of the total relative asymmetry of the registration sheet No. 4-1 during the growing season (Table 9).
Table 9 and Figure 4 show the parameters of the model (2) and graphs identified by the computational capabilities of the CurveExpert- 1.40 software environment. The overall correlation coefficient is 0.9972, which indicates a very high level of adequacy of the identified statistical model. At the same time, both trend members received a negative sign, which indicates an increase in the right-sided asymmetry during the growing season.
The third and fourth members of the model in Table 9, as asymmetric wavelets, actually show the dynamics of the process of multiple fluctuations (oscillations) of leaf asymmetry. They have a positive sign, so they show the tendency of the accounting birch leaf back to the left-sided asymmetry. As a result, there is an oscillatory adaptation of the development and growth of the registration sheet to changes in the air environment surrounding sheet No. 4-1. The fluctuation is physically always directed towards equalization between the left-handed and right-handed asymmetries. With the annual growth and development of birch, is directional evolution observed in changes in buds and leaves? This question can be answered by annual measurements of leaf parameters on one branch of silver birch with a minimum sample of five leaves [44-46].
The fifth wavelet signal of the model (2) and the residuals after it are shown in Figure 5.
The fifth wave of oscillatory perturbation (fluctuation) covers the time interval 163 - 44 = 119 days of the growing season of 163 days. By a negative sign, this term of the model from table 9 shows the tendency to right-sided asymmetry.
The modeling error is estimated by the residuals from the fiveterm model from Table 9 (Table 10).
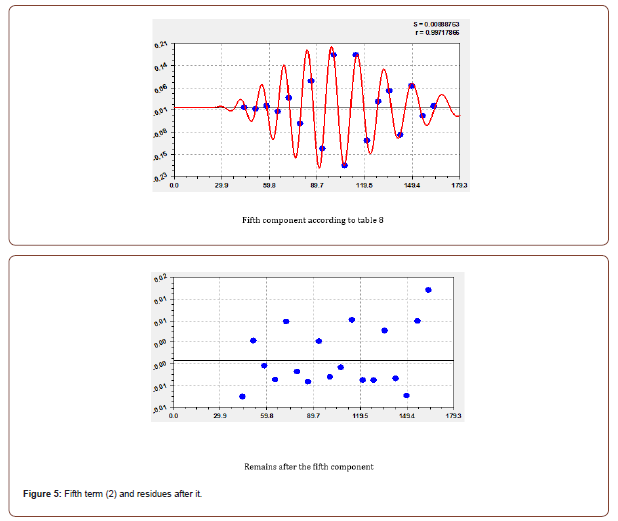
Table 10:Fifth term (2) and residues after it.
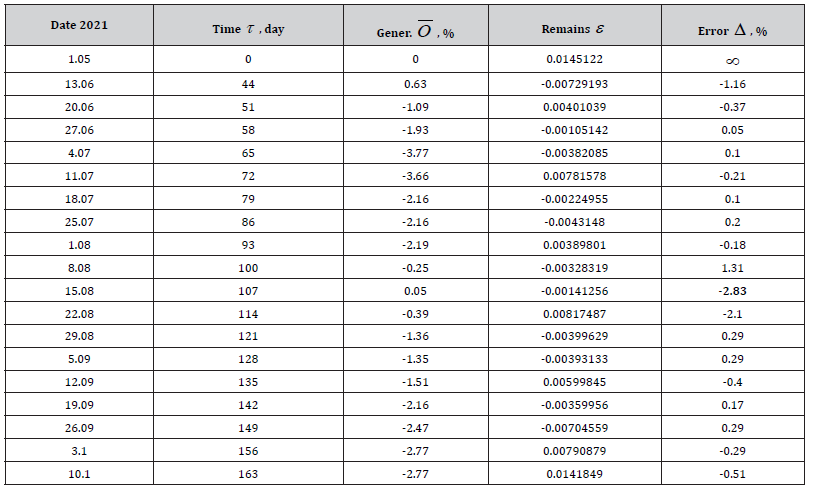
The maximum relative modeling error modulo is only 2.83%. Then the wavelet analysis of the behavior of birch leaf No. 4-1 gives a reliable picture of the dynamics of behavior during the growing season.
Moreover, the wave behavior of a separate accounting sheet can be studied even without recording the parameters of the air microenvironment surrounding this sheet.
In the future, it will be possible to study the influence of phenotypic parameters by measuring the environment with devices.
We distinguish two types of behavioral quanta in the ontogeny of birch leaves during the growing season:
firstly, in dynamics, each factor of 12 distinguishing features, including the general relative asymmetry, is divided into a sum of wavelets, that is, in time this factor is represented as a bundle of solitary waves (solitons) and this process is characterized as quantum certainty;
secondly, the mutual influence of the 12 above morphological features with a measurement frequency every seven days additionally receives quantum uncertainty (in quantum mechanics, quantum entanglement, and in macroobjects in the form of accounting leaves, quantum uncertainty) at the beginning of the growing season up to 30 days. At the beginning of ontogenesis, we get infinity, that is, uncertainty, which will need to be revealed in the future.
Then any phenomenon or process in the life of growing birch leaves can be assessed by the level of adequacy (correlation coefficient) of the decomposition of the functional connectivity of the “leaf - microenvironment” system into quantum certainty and uncertainty.
We believe that birch plants, over more than 180 million years of evolution on Earth, have learned to understand the quantum behavior of their vegetative organs through the biological mechanism of oscillatory adaptation to changes in temperature, pressure and air humidity, as well as the parameters of the location of different zones in the tree crown.
Patterns of ontogeny dynamics in 25 birch leaves: Table 6 shows the average relative asymmetries for 25 accounting birch leaves in the dynamics of ontogeny.
After structural-parametric identification (2), the formula was obtained

This formula is a two-term trend, and both trend components are special cases of the wave function (2), provided that the half-period of the oscillation is much greater than the interval of the growing season. In this case, it is accepted →∞ i a5 and the cosine function in formula (2) turns into 1.
The first term is the Mandelbrot law (in physics) modified by us c ≠1 , subject to the exponential growth law. Mandelbrot’s law has the form y = a exp(±bx ) . It is also called the Laplace law in mathematics, the Zipf-Pearl law in biology, and the Pareto law in econometrics. In this case, the first term of equation (15) characterizes the natural increase in the parameters of the sheet plate, and other components, including wave ones, give the influence of factors external to the sheet.
Then it turns out (Figure 6) that the second component (15), due to the negative sign, shows the negative impact of external phenotypic factors on the development and growth of the leaf organism according to the formula of a power mathematical function.
In the process of ontogenesis of 25 countable leaves from formula (15), at the time of bud break, an average left-sided asymmetry of 0.0060% is typical. Then it increases to 79 days, and after that it gradually decreases, reaching an equilibrium between the left and right sides of the leaves in 121 days.
After this moment, there is a transition to right-sided asymmetry, and the transition process continues up to 149 days. Then the population of 25 counted leaves again tries to go to the left asymmetry. Zero relative asymmetry, that is, a certain balance or symmetry, four leaves reach a growing season of 163 days, but then these accounting leaves also fall off.
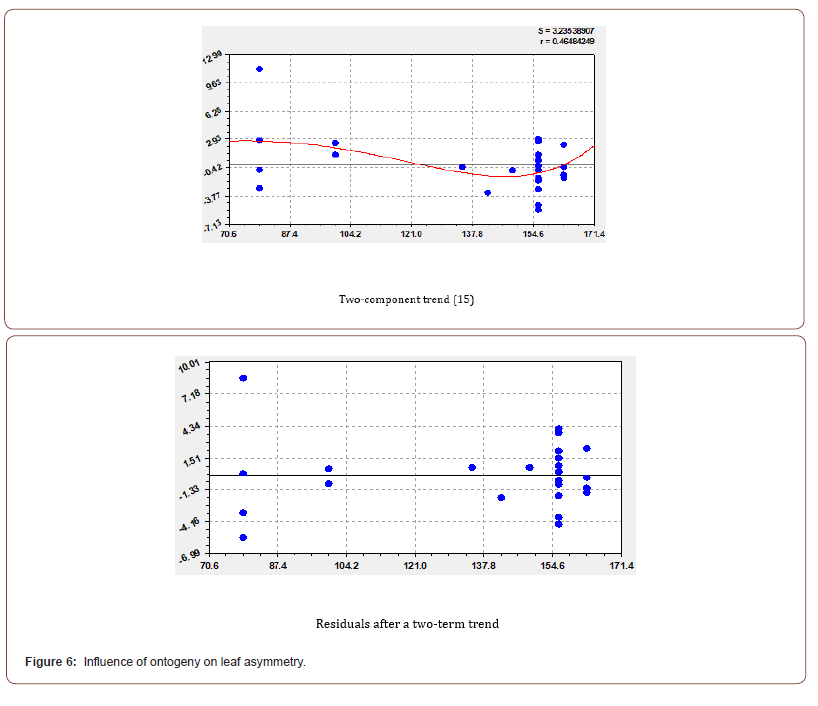
Due to the influence of phenotypic factors, the function O = f (T ) receives the level of adequacy “weak connection” (0.3- 0.5) with a correlation coefficient of 0.4648.
A significant number of accounting leaves (11 pieces) reached the growing season of 156 days. To increase the reliability of the model (15), further experiments need to understand the effect of the growing season from 150 to 162 days when measured, for example, every day. At the beginning of the growing season, measurements should be taken three days later, starting from 30 days (instead of 44) after the start of the growing season. Finally, using a complex of phenometric instruments, one should measure the phenotypic factors of the drooping air microenvironment surrounding the accounting birch leaves in order to identify their influence on the dynamics of ontogenesis.
Conclusion
A method is proposed for measuring the relative asymmetry of six morphological features (maximum width, height of maximum width, length of the second-order vein, distance between the bases of the veins, the distance between their ends, the angle between the main and second vein) in the dynamics of the growing season on the left and right sides of each leaf. birches (Betula pendula) without cutting them. Moreover, the growing season is taken equal to zero at the time of bud break. Measurements begin after 28-30 days from the beginning of ontogenesis.
All six morphological parameters are found in the main part of the list near the petiole. For measurements, a transparent palette with a grid (cells 2 × 2 mm) is placed on a growing leaf from the front side without cutting it so that the middle line along the palette coincides with the axis of the longitudinal vein. A solid white substrate is placed on the back of the sheet. Then the sheet with the palette is photographed with a digital camera with the function of storing photographs. On the computer, each photo of the sheet is cropped, then the photo is enlarged for measurements up to A4 format.
Each birch registration sheet has its own character of behavior. The comparison shows that for one record sheet strong in the growing season, all 12 morphological indicators differ significantly from the average for the leaf group. New sheet parameters were introduced: absolute asymmetry of the left from the right sides of the sheet; relative asymmetry, %. In this case, the “+” sign will show left-sided asymmetry, and with the “-” sign there will be right-sided asymmetry of the birch accounting sheet. The dynamics of ontogeny is characterized by the fact that each leaf during the growing season can move several times from left to right asymmetry and vice versa. The total relative asymmetry of the birch count sheet according to six left and six right morphological characters is calculated as one sixth of the sum of relative asymmetries.
On average, for 25 counted leaves, a relative asymmetry of 0.034% was obtained. For individual accounting leaves, a wide range of changes in relative asymmetry was obtained from -5.45% (right asymmetry) to 11.31% (left asymmetry).
According to the results of descriptive statistics of 18 measurements, without taking into account zero, on one accounting sheet, a measurement error of 1% was accepted and Student’s criterion is 2.88. Then the maximum allowable number of observations is 6 pcs. However, at least 15 measurements are required to identify wave patterns by the method of identification. The measurements were carried out every 7 days (1/4 of the lunar cycle).
For one accounting sheet of birch, the identification method revealed a wave equation consisting of five components. For the first four components, the overall correlation coefficient is 0.9972, which indicates a very high level of adequacy. At the same time, both trend members received a negative sign, which indicates an increase in the right asymmetry during the growing season. The third and fourth members of the model, as asymmetric wavelets, show the dynamics of the leaf asymmetry fluctuation process.
They have a positive sign, so they show the tendency of the birch count sheet back to the left asymmetry. As a result, there is an oscillatory adaptation of the development and growth of the registration sheet to changes in the air microenvironment surrounding the sheet. The fluctuation is directed towards equalizing the asymmetry. The fifth wave of oscillatory perturbation (fluctuation) covers the entire measured interval of 163 - 44 = 119 days of the growing season of 163 days. By a negative sign, it shows the desire for asymmetry on the right side of the birch leaf. The maximum relative simulation error is 2.83%.
According to the average relative asymmetries for 25 countable leaves in the dynamics of their ontogenesis, a trend containing two terms was obtained. The first component is the modified by the author of the article Mandelbrot’s law (in physics) in the exponential growth law y = a exp(bx c ) . The original Mandelbrot law has the form y = a exp(±bx ) . The first term of the trend characterizes natural growth. The second term in the form of a power function, due to the negative sign, shows the negative impact of the environment on the development and growth of accounting leaves in the dynamics of ontogeny.
In the process of ontogeny, for 25 registered leaves at the time of bud break, an average left-sided asymmetry of 0.0060% is typical. Then it increases to 79 days, and after that it decreases, reaching an equilibrium between the left and right sides of the leaves in 121 days. After this moment, there is a transition to the right asymmetry up to 149 days. Then the population of 25 leaves again tries to go to the left asymmetry. The strongest four leaves reach zero relative asymmetry until the vegetation period of 163 days, but then all the countable leaves have already fallen off.
Acknowledgement
None.
Conflict of Interest
None.
References
- Kamensky AA, Kriksunov EA, Pasechnik VV (2005) General biology, grades 10-11: textbook. M.: Bustard p. 367.
- Takhtadzhyan A L (1970) Origin and distribution of flowering plants. L.: Publishing house "Nauka", Leningrad. Dep pp. 1-147.
- Takhtajan AL (1986) Floristic regions of the world. The Regents of the University of California p. 523.
- VN Yarygin, VI Vasilyeva, I N Volkov, VV Sinelytsikova (2003) In 2 books. Book. 1: Study. for medical specialist. universities / Biology. (5th Edn)., rev. and additional M.: Higher. school p. 432.
- Evstigneev OI, Ruchinskaya EV, Gornov AV (2018) Ontogeny and state of Iris Aphylla (iridaceae) cenopopulations in the Bryansk region. Bot. j 103(2): 207-223.
- Rabotnov TA (1950) Life cycle of perennial herbaceous plants in meadow cenoses, Tr. BIN AN USSR. Ser. 3. Geobotany. M.; -L. 6-204.
- Uranov AA (1975) Age spectrum of phytocoenopopulations as a function of time and energy wave processes. Biological Sciences 2: 7-34.
- Rabotnov TA (1946) Experience in determining the age of herbaceous plants. Bogt Zh 31(5): 24-28.
- Nikolaeva OA, Semenova VV, Danilova NS (2021) Ontogeny and structure of Gagea pauciflora (liliaceae) cenopopulations in central Yakutia, Bot. journal 106(1): 43-51.
- Uranov AA (1964) Observation in summer practice in botany: A guide for students. (2nd Edn)., revised. and additional M.: Enlightenment p. 216.
- Schnelle F, (1961) Phenology of plants: Per. from German. Leningrad: Gidrometeoizd p. 260.
- Vasfilov SP (2015) Influence of photosynthesis parameters on leaf lifespan.
- Karmanova TN, Feoktistova N Yu, Fetisova EEA, Mosalov AA, AV Surov AV, et al. (2021) Ecology of the city: retrospective and perspectives of study. Journal of General Biology T 82(3): 163-174.
- Zakharov VM, Kryazheva NG, Dmitriev SG, Trofimov IE (2011) Evaluation of possible changes in the state of populations due to climate change (on the example of the study of the stability of the development of silver birch). Successes of modern biology 131(4): 425-430.
- Bogolyubov AS (2002) Assessment of the ecological state of the forest by the asymmetry of the leaves. M.: Ecosystem 10 з.
- Zakharov VM, Chubinishvili AT, Dmitriev SG, Baranov AS, Borisov VI, et al. (2000) Health of the environment: assessment practice. M.: Center for Environmental Policy of Russia p. 320.
- Mazurkin PM, Kudryashova AI (2015) Dynamics of birch tree leaves ontogeny. Yoshkar-Ola: Volga GTU p. 172.
- Tokareva NI, Mazurkin PM (2021) The method of photodynamics of the vegetation of drooping birch leaves Youth for a clean Volga: coll. scientific works and environmental projects Vseross. youth scientific image. festival. Cheboksary: Ed. Wednesday house pp. 317-323.
- Mazurkin PM (2014a) Method of identification 14th International multidisciplinary scientific geoconferenct & SGEM2014. GeoConference jn nano, bio and green – technologies for a sustainable future. Conference proceedincs (Scopus). Vol. 1. Section Advances in Biotechnology. Albena, Bulgaria p. 427-434.
- Mazurkin PM (2014b) Identification of the wave patterns of behavior 14th International multidisciplinary scientific geoconferenct & SGEM2014. GeoConference jn nano, bio and green – technologies for a sustainable future. Conference proceedincs (Scopus). Section Advances in Biotechnology. Albena, Bulgaria 1: 373-380.
- Mazurkin PM (2015a) Wavelet Analysis Statistical Data. Advances in Sciences and Humanities 1(2): 30-44.
- Mazurkin PM (2015b) Invariants of the Hilbert Transform for 23-Hilbert Problem, Advances in Sciences and Humanities 1(1): 1-12.
- Mazurkin PM (2015c) Method for identifying regularities. Uniform All-Russian Scientific Bulletin 1: 98-105.
- Mazurkin PM (2016) Statistical identification of time series Bulletin of world science. Series "Economics" 1: 79-96.
- Mazurkin PM (2018) Ecological methods for assessing the quality of the environment by fluctuating asymmetry of birch leaves Scientific Review. Biological Sciences 5: 15-21.
- Mazurkin PM, Kudryashova AI (2018a) Wave dynamics of ontogenesis of leaves around automobile road. International Multidisciplinary Scientific GeoConference Surveying Geology and Mining Ecology Management, SGEM 18(5.1): 1023-1030.
- Mazurkin PM, Kudryashova AI (2018b) Method of measurement of dynamics of growth of leaves of the tree in clean ecological conditions. International Multidisciplinary Scientific GeoConference Surveying Geology and Mining Ecology Management, SGEM 18(5.1): 517-524.
- Mazurkin PM, Kudryashova AI (2018c) Fito Urban Meteorology: Influence of the Amount of the Temperature on the Ontogeny of the Leaves of the Silver Birch. J. Basic Sci. Appl. Res 4(2): 1-15.
- Mazurkin PM, Kudryashova AI (2018d) Fito meteorologiya City: The Influence of the Amount of Relative Humidity of Air Ontogenesis Leaves of Birch. J. Basic Sci. Appl. Res 4(1): 1-15.
- Mazurkin PM, Kudryashova AI (2019a) Factor analysis of meteoparameterson the stage of growth of birch leaves. International Journal of Current Research 11(10): 7774-7779.
- Mazurkin PM, Kudryashova AI (2019b) Quantum fitometeorology. International Multidisciplinary Scientific GeoConference Surveying Geology and Mining Ecology Management, SGEM 19(5.1): 609-617.
- Mazurkin PM, Kudryashova AI (2019c) Patterns of phytoindication pollution of the urban environment the maximum width of the leaves of the silver birch. Journal of Chemical, Biological and Physical Sciences (J. Chem. Bio. Phy. Sci). Sec. D 9: 3.
- Mazurkin PM (2021) Influence of coordinates and altitude above sea level on life parameters, urban population forecast Successes of modern natural science 8: 64-71.
- Mayer H, (1993) Urban bioclimatology. Experientia. 49(11):957-963.
- Otto A, Göpfert C, Thieken AH (2021) Are cities prepared for climate change? An analysis of adaptation readiness in 104 German cities. Mitig Adapt Strateg Glob Change 26: 35.
- Hondula D, Balling R, Andrade R, Krayenhoff S, Middel E, et al. (2017) Biometeorology for cities. International journal of biometeorology 61: 59-69.
- Polgar CA, Primack RB (2011) Leaf‐out phenology of temperate woody plants: from trees to ecosystems. New Phytologist 191(4): 926-941.
- Thitz P, Possen BJHM, Oksanen E, Mehtätalo L, Virjamo V, et al. (2017) Production of glandular trichomes responds to water stress and temperature in silver birch (Betula pendula) leaves. Canadian Journal of Forest Research 47(8): 1075-1081.
- Mazurkin PM, Kudryashova AI (2019f) Urban phytometeorology: the influence of the sum of temperatures on the ontogenesis of drooping birch leaves. Geographical Bulletin 4(51): 45-58.
- Mazurkin PM, Kudryashova AI (2016) Elements of the vegetation cover of the urban environment. Yoshkar-Ola: Volga GTU p. 176.
- Wasserstein RL, Schirm AL, Lazar NA (2019) Moving to a World Beyond “p < 0.05”. The American Statistician 73(1): 1-19.
- Mazurkin PM, Kudryashova AI (2019d) Regularities in the dynamics of the width of each leaf of birch near the maximum growth during the growing season Successes of modern natural sciences 10: 65-72.
- Mazurkin PM, Kudryashova AI (2019e) Patterns of the dynamics of the average width of birch leaves near the maximum growth during the growing season Successes of modern natural science 11: 113-120.
- The asymmetry of matter and antimatter is proved (2021) Source Bad Android.
- Lovelius NV (1979) Variation in tree growth, dendroindication of natural processes and anthropogenic impacts. L.: Science p. 232.
- Mazurkin PM, Kudryashova AI (2019g) Influence of birch coordinates on highways on the average growing season and the maximum width of counted leaves Successes of modern natural science 9: 58-64.
-
P. M. Mazurkin*. Symmetry of a Set of Leaves in The Average And Asymmetry of Each Leaf of a Birch (Betula Pendula) In The Dynamics of Ontogenesis. Annal Biostat & Biomed Appli. 5(2): 2023. ABBA.MS.ID.000610.
Birch, Leaves, Ontogeny, Dynamics, Patterns, Fluctuating asymmetry, Biochemical properties, Phytocenology, Plant biology, Photodynamics
-

This work is licensed under a Creative Commons Attribution-NonCommercial 4.0 International License.


